
Nordic Fire Statistics
The purpose of Nordic Fire Statistics is to provide statistics on fire deaths and building fires which are of sufficient quality to allow a comparison of the fire problem across the Nordic countries and Estonia.
On this page
Nordic Fire Statistics – a work in progress
Statistics on fire deaths and building fires in the Nordic countries have been published on this website for several years. It is now time to revise the contents and publish statistics in a new way.
For a short period, this site will have some basic statistics covering the most recent years for which data has been compiled. More statistics will become available when the participating countries have agreed on definitions for the new content and provided updated data sets.
Fire deaths
In recent years, Denmark, Finland, Norway, and Sweden have experienced a broadly similar level of fire deaths measured as a yearly rate per million population. The level of fire deaths is lower in Iceland, and higher in Estonia.
-
Statistics on fire deaths
The central authorities in the participating countries follow up all fire deaths that come to their knowledge. If relevant information is available, they make an assessment about the location and cause of the fire, and how the fire has led to the fatal injuries sustained by the fire victims.
To be included in these statistics, the fire authority must assess that the death has occurred within 30 days due to injuries sustained in a fire (most often burns or the toxic effects of smoke).
Fire deaths per year 2016 – 2025
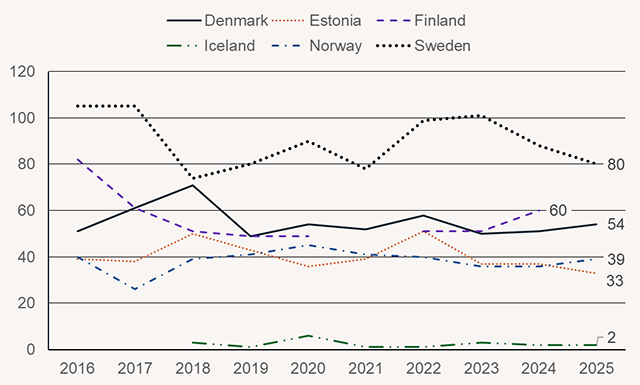
Fire deaths per year and country 2016-2025
Fire deaths per year 2010 – 2025 (Excel)
When comparing countries, it is relevant to relate the number of fire deaths to the population in each country. The diagram below shows the yearly rate per million population. It is interesting to note that in recent years, Denmark, Finland, Norway, and Sweden have experienced a broadly similar level of fire deaths.
The level of fire deaths is lower in Iceland, but they have a relatively low population and there are often years when no fire deaths occur. The death rate due to fire is substantially higher in Estonia, but politicians have agreed on the goal of reducing this to the level of the Nordic countries, and the current level is far lower than in 2010.
Fire deaths per million population 2016 – 2025
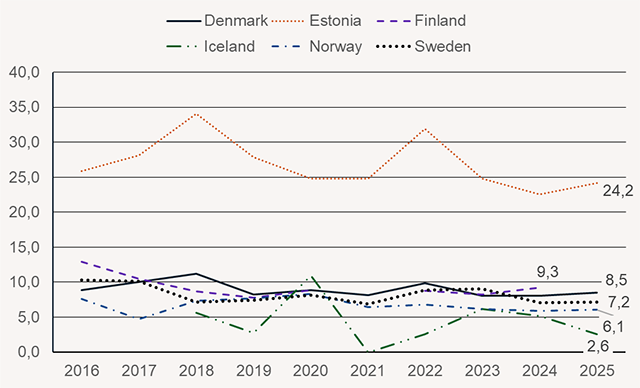
Fire deaths per million population 2016-2025
Fire deaths per million population 2010 – 2025 (Excel)
Fire deaths by scene of fire, yearly average 2016 – 2025
Scene Denmark Estonia Finland Norway Sweden Block of flats 17,4 16,5 13,3 6,7 33,4 House 25,7 17,6 29,9 21,2 37,4 Summerhouse 1,4 2,4 4,4 1,7 2,4 Health and social services 5,9 0,5 0,4 2,1 3,7 Other building 2,5 1,9 3,9 2,7 2,4 Road vehicles 1,1 0,2 2,8 1,1 6,0 Other outdoor 0,7 1,2 2,3 2,6 4,3 Unknown outdoor 0,4 0,0 0,0 0,2 0,4 Figures for Iceland will be provided when the contents of this website are revised. The figures for Finland are 8-year averages, excluding 2021 and 2025.
Fire deaths by month of fire, yearly average 2016 – 2025
Month Denmark Estonia Finland Norway Sweden January 6,2 4,4 6,6 4,5 10,8 February 4,5 3,6 5,6 4,0 7,1 March 6,0 4,3 4,3 3,8 9,0 April 4,7 4,0 4,5 2,8 7,6 May 4,4 3,8 4,8 1,9 6,9 June 4,0 1,1 3,3 1,7 6,9 July 2,9 1,4 2,3 2,3 5,6 August 1,8 1,0 3,8 2,3 4,0 September 3,6 2,1 5,9 3,0 5,4 October 4,2 3,5 5,1 3,3 7,1 November 6,3 3,5 5,5 2,7 7,5 December 6,0 7,6 5,3 6,0 11,7 Figures for Iceland will be provided when the contents of this website are revised. The figures for Finland are 8-year averages, excluding 2021 and 2025.
Building fires
In recent years the yearly rate of building fires in the Nordic countries and Estonia has ranged between 600 and 1100 fires per million population.
-
Statistics on building fires
These statistics concern building fires which the fire and rescue service have been called to, and which are assessed by the fire and rescue service to have caused injury or damage to property.
All the participating countries present statistics for various kinds of buildings, but the categories are not always comparable, in particular for non-residential buildings. Unfortunately, the only way to present comparable statistics is to group all non-residential buildings together in a single category.
Building fires per year 2016 – 2025
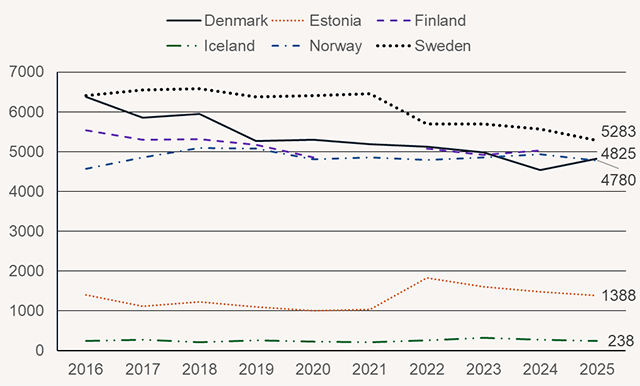
Building fires per year 2016 – 2025
Building fires per year 2016 – 2025 (Excel)
Building fires per million population 2016 – 2025
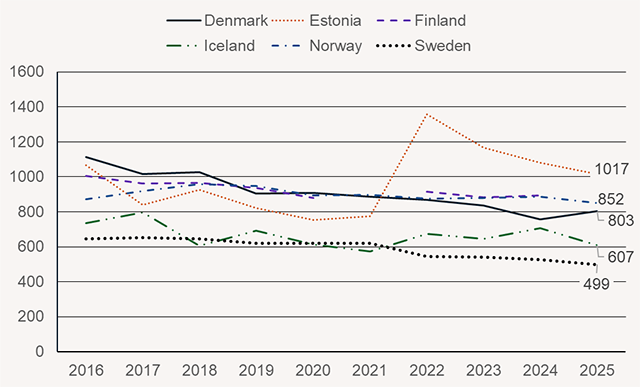
Building fires per million population 2016 – 2025
Building fires per million population 2016 – 2025 (Excel)
Building fires by category, yearly average 2016 – 2025
Category Denmark Estonia Finland Norway Sweden Block of flats 887 464 1 252 1 240 1 728 House 1 831 296 1 526 1 814 1 680 Summerhouse 144 53 158 135 184 Other building 2 476 503 2 215 1 673 2 51 Figures for Iceland will be provided when the contents of this website are revised. The figures for Finland are 8-year averages, excluding 2021 and 2025.
Building fires by month, yearly average 2016 – 2025
Month Denmark Estonia Finland Norway Sweden January 513 131 472 442 551 February 409 101 371 355 464 March 449 107 404 396 507 April 488 119 421 417 531 May 496 126 490 431 562 June 463 120 481 400 525 July 409 106 444 380 490 August 401 104 434 390 495 September 387 98 404 393 457 October 382 97 395 410 473 November 402 93 401 394 474 December 540 113 434 456 576 Figures for Iceland will be provided when the contents of this website are revised. The figures for Finland are 8-year averages, excluding 2021 and 2025.
About Nordic Fire Statistics
The central fire authorities in the Nordic countries all produce fire statistics based on data collected from their fire and rescue services.
Twenty years ago, the directors general for the central fire authorities in the Nordic countries agreed to initiate a collaboration on fire statistics. The aim was to improve the comparability in the fire statistics produced in the various countries, to compare emerging trends and to learn from each other about methods for statistical analysis to better inform the work of fire prevention.
Politicians in Estonia have agreed on the goal of reducing their level of fire deaths to that of the Nordic countries, and Estonia has therefore joined this collaboration to ensure the quality of their benchmarking with Nordic colleagues.
As a result of this cooperation on fire statistics, it is possible to provide statistics on fire deaths and building fires which are of sufficient quality to allow a very basic comparison of the fire problem across the Nordic countries and Estonia.
Contacts
This website is hosted by Swedish Civil Contingencies Defence and Resilience. If you have general questions concerning the statistics or how we have chosen to publish them on this website, you are welcome to contact us in Sweden. For questions relating to the figures from a specific country, it is more appropriate to get in touch with that country, as they will have a fuller understanding of how the data has been compiled.
Denmark
Danish Emergency Management Agency (Beredskabsstyrelsen)
General website: www.brs.dkStatistics website: statistikbank.brs.dk/Britt Løwe Nyborg: brs-bln@brs.dk
Steen Hjere Nonnemann: brs-shn@brs.dk
Estonia
Estonian Rescue Board (Päästeamet)
General website: www.rescue.ee
Statistics website: www.rescue.ee/et/statistika
Maris Uuetoa: maris.uuetoa@rescue.ee
Oleg Morozov: oleg.morozov@rescue.ee
Finland
Emergency Services Academy (Pelastusopisto)
Statistics website: pelastustoimi.fi/en/rescue-services/statistics
Heidi Liukkonen: heidi.liukkonen@pelastusopisto.fi
Timo Loponen: timo.loponen@pelastusopisto.fi
Ministry of the Interior (Sisäministeriö)
Tiina Etelälahti: tiina.etalalahti@gov.fi
Wellbeing Services County Company Hyvil Oy (Hyvinvointialueyhtiö Hyvil Oy)
Esa Kokki: esa.kokki@hyvil.fi
Iceland
Housing and Construction Authority (Húsnæðis- og mannvirkjastofnun)
Grétar Þór Þorsteinsson: gretar.thorsteinsson@hms.is
Norway
Norwegian Directorate for Civil Protection (Direktoratet for samfunnssikkerhet og beredskap)
Statistics website: www.dsb.no/menyartikler/statistikk/
Reidun Mo: reidun.mo@dsb.no
Vidar Falkenberg: vidar.falkenberg@dsb.no
Sweden
Swedish Civil Defence and Resilience Agency
Colin McIntyre: colin.mcintyre@mcf.se
Joakim Ekberg: joakim.ekberg@mcf.se
Maria Håkansson: maria.hakansson@mcf.se